import matplotlib
if not hasattr(matplotlib.RcParams, "_get"):
    matplotlib.RcParams._get = dict.get
Lecture 32: Single-Server Queueing Systems in Python#
Note
This lecture details how to simulate a single-server queueing system developing the simulation logic along with its implemenation in Python
Simulation Logic#
\[\begin{split}
\begin{aligned}
1.\ & \textbf{Procedure } \text{ssq}(n, A, S) \\
2.\ & \text{// SYSTEM STATUS} \\
3.\ & \varphi \gets 0 \quad \text{// server idle/busy} \\
4.\ & j \gets 0 \quad \text{// queue length} \\
5.\ & \text{// SYSTEM DYNAMICS} \\
6.\ & T_a \gets \{\} \quad \text{// customer arrival time} \\
7.\ & T_s \gets \{\} \quad \text{// customer service start time} \\
8.\ & T_d \gets \{\} \quad \text{// customer departure time} \\
9.\ & \text{// SYSTEM LOG} \\
10.\ & T_o \gets \{\} \quad \text{// event time (arrival/service initiation/departure)} \\
11.\ & Q \gets \varnothing \quad \text{// queue } \\
11.\ & \Phi \gets \{\} \quad \text{// server status at event time} \\
12.\ & J \gets \{\} \quad \text{// queue length at event time} \\
13.\ & \text{// INITIALIZATION} \\
14.\ & t \gets 0 \quad \text{// simulation clock} \\
15.\ & i \gets 0 \quad \text{// index of customer in service} \\
16.\ & k \gets 0 \quad \text{// customers serviced} \\
17.\ & t_a \gets A_1 \quad \text{// next arrival event time} \\
18.\ & t_d \gets \infty \quad \text{// next departure event time} \\
20.\ & \textbf{while } k < n \ \textbf{do} \\
21.\ & \quad \textbf{if } t_a \leq t_d \ \textbf{then} \quad \text{// time jump to next customer arrival event} \\
22.\ & \quad\quad e \gets \text{a} \\
23.\ & \quad\quad t \gets t_a \\
24.\ & \quad \textbf{else} \quad \text{// time jump to next customer departure event} \\
25.\ & \quad\quad e \gets \text{d} \\
26.\ & \quad\quad t \gets t_d \\
27.\ & \quad \textbf{end if} \\
28.\ & \quad \textbf{if } e = \text{a} \ \textbf{then} \quad \text{// update system status for customer arrival} \\
29.\ & \quad\quad \varphi \gets \varphi \\
30.\ & \quad\quad j \gets j + 1 \\
31.\ & \quad\quad \textbf{if } \varphi = 0 \ \textbf{then} \\
32.\ & \quad\quad\quad e \gets \text{s} \\
33.\ & \quad\quad \textbf{end if} \\
34.\ & \quad\quad T_a \gets T_a \cup \{t\} \\
35.\ & \quad\quad T_o \gets T_o \cup \{t\} \\
36.\ & \quad\quad Q \gets Q \cup \{i+j\} \\
37.\ & \quad\quad \Phi \gets \Phi \cup \{\varphi\} \\
38.\ & \quad\quad J \gets J \cup \{j\} \\
39.\ & \quad\quad t_a \gets (i+j+1 \leq n) \ ? \ t + A_{i+j+1} : \infty \\
40.\ & \quad \textbf{else if } e = \text{d} \ \textbf{then} \quad \text{// update system status for customer departure} \\
41.\ & \quad\quad \varphi \gets 0 \\
42.\ & \quad\quad j \gets j \\
43.\ & \quad\quad \textbf{if } j = 0 \ \textbf{then} \\
44.\ & \quad\quad\quad t_d \gets \infty \\
45.\ & \quad\quad \textbf{else} \\
46.\ & \quad\quad\quad e \gets \text{s} \\
47.\ & \quad\quad \textbf{end if} \\
48.\ & \quad\quad T_d \gets T_d \cup \{t\} \\
49.\ & \quad\quad T_o \gets T_o \cup \{t\} \\
50.\ & \quad\quad \Phi \gets \Phi \cup \{\varphi\} \\
51.\ & \quad\quad J \gets J \cup \{j\} \\
52.\ & \quad\quad k \gets k + 1 \\
53.\ & \quad \textbf{end if} \\
54.\ & \quad \textbf{if } e = \text{s} \ \textbf{then} \quad \text{// update system status for customer service initiation} \\
55.\ & \quad\quad \varphi \gets 1 \\
56.\ & \quad\quad j \gets j - 1 \\
57.\ & \quad\quad i \gets \text{pop}(Q) \\
58.\ & \quad\quad T_s \gets T_s \cup \{t\} \\
59.\ & \quad\quad T_o \gets T_o \cup \{t\} \\
60.\ & \quad\quad \Phi \gets \Phi \cup \{\varphi\} \\
61.\ & \quad\quad J \gets J \cup \{j\} \\
62.\ & \quad\quad t_d \gets t + S_i \\
63.\ & \quad \textbf{end if} \\
64.\ & \textbf{end while} \\
65.\ & d \gets \dfrac{\sum_{i=1}^{n}(T_{s_i} - T_{a_i})}{n} \quad \text{// average delay} \\
66.\ & q \gets \dfrac{J \cdot T_j}{t} \quad \text{// average queue length} \\
67.\ & u \gets \dfrac{\Phi \cdot T_o}{t} \quad \text{// average utilization} \\
68.\ & \textbf{return } \{d, q, u\}
\end{aligned}
\end{split}\]
def ssq(n, A, S, silent=False):
    """
    This function simulates a single-server queueing system for n customers given their inter-arrival times - A, and service times - S

    Parameters
    ---
    n: int
        number of customers
    A: list[float]
        customer inter-arrival times
    S: list[float]
        customer service times
    silent=False: bool
        run in silence if True else display system

    Returns
    ---
    d: float
        average delay
    q: float
        average queue length
    u: float
        average utilization
    """
    # System Status
    t  = 0              # simulation clock
    z  = 0              # server status
    Q  = []             # queue
    # System Dynamics
    Ta = []             # customer arrival time
    Ts = []             # customer service initiation time
    Td = []             # customer depature time
    # System Log
    To = [0]            # event time (customer arrival/service initiation/departure time)
    Z  = [0]            # server status at event time
    J  = [0]            # queue length at event time
    # Initialization
    i  = -1             # index of last customer serviced
    j  = 0              # queue length
    k  = 0              # customers serviced
    ta = A[0]           # next arrival event time
    td = A[0] + S[0]    # next departure event time
    # Loop
    while k < n:
        if ta <= td:    # time jump to next customer arrival event
            e = 1
            t = ta
        else:           # time jump to next customer departure event
            e = -1
            t = td
        if e == 1:      # update system status for customer arrival
            To.append(t)
            Ta.append(t)
            if z == 0:
                e = 0
                i = i + 1
            else:
                Q.append(i+j+1)
                j = j + 1
            ta = round(ta + A[i+j+1], 1) if i+j+1 < len(A) else float('inf')
            Z.append(z)
            J.append(j)
            if not silent: print("Arrival      :     ", " ", "X", i , Q)
        elif e == -1:   # update system status for customer departure
            if not silent: print("Departure    :   ", i, "X", " ", Q)
            To.append(t)
            Td.append(t)
            if j == 0:
                z  = 0
                td = float('inf')
            else:
                e  = 0
                i  = Q.pop(0)
                j  = j - 1
            Z.append(z)
            J.append(j)
            k = k + 1
        if e == 0:      # update system status for customer service initiation
            To.append(t)
            Ts.append(t)
            z  = 1
            td = t + S[i]
            Z.append(z)
            J.append(j)
            if not silent: print("Service      :     ", " ", "X", i, Q)
    T = [To[i]-To[i-1] for i in range(1,len(To))] + [0.0]
    d = round(sum([Ts[i] - Ta[i] for i in range(n)]) / n, 3)        # average delay
    q = round(sum([J[i] * T[i] for i in range(len(T))]) / t, 3)     # average queue length
    u = round(sum([Z[i] * T[i] for i in range(len(T))]) / t, 3)     # average utilization
    return d, q, u
# Single Simulation Outcomes
n = 6
A = [0.4, 1.2, 0.5, 1.7, 0.2, 1.6, 0.2, 1.4, 1.9]
S = [2.0, 0.7, 0.2, 1.1, 3.7, 0.6, 1.0, 1.0, 1.0]
ssq(n, A, S)
Arrival      :        X -1 [0]
Service      :        X 0 []
Arrival      :        X 0 [1]
Arrival      :        X 0 [1, 2]
Departure    :    0 X   [1, 2]
Service      :        X 1 [2]
Departure    :    1 X   [2]
Service      :        X 2 []
Departure    :    2 X   []
Arrival      :        X 2 [3]
Service      :        X 3 []
Arrival      :        X 3 [4]
Departure    :    3 X   [4]
Service      :        X 4 []
Arrival      :        X 4 [5]
Arrival      :        X 4 [5, 6]
Arrival      :        X 4 [5, 6, 7]
Departure    :    4 X   [5, 6, 7]
Service      :        X 5 [6, 7]
Arrival      :        X 5 [6, 7, 8]
Departure    :    5 X   [6, 7, 8]
Service      :        X 6 [7, 8]
(0.95, 1.217, 0.902)
import random
import numpy as np
import pandas as pd
import matplotlib.pyplot as plt
def simulate(sims=1000, n=100, lam=0.8, mu=1.0):
"""
Run Monte Carlo simulation of SSQ using exponential inter-arrivals and service times.
Parameters
----------
sims : int
number of simulations (default=1000)
n : int
number of customers per run (default=100)
lam : float
arrival rate λ
mu : float
service rate μ
Returns
-------
df : pandas.DataFrame
Results with columns ['d','q','u']
"""
# Random simulations
results = []
for k in range(sims):
rng = random.Random(k)
# Generate n+5 to avoid indexing issues in ssq
A = [rng.expovariate(lam) for _ in range(n+5)]
S = [rng.expovariate(mu) for _ in range(n+5)]
d, q, u = ssq(n, A, S, silent=True)
results.append((d, q, u))
return pd.DataFrame(results, columns=["d","q","u"])
# Descriptive statistics
def describe_series(x: pd.Series):
arr = np.asarray(x, dtype=float)
mean = float(np.mean(arr))
median = float(np.median(arr))
rng = float(np.max(arr) - np.min(arr))
sd = float(np.std(arr, ddof=1))
iqr = np.percentile(arr, 75) - np.percentile(arr, 25)
skew = np.mean((arr - mean)**3) / (sd**3) if sd > 0 else np.nan
kurt = np.mean((arr - mean)**4) / (sd**4) - 3 if sd > 0 else np.nan
return {
"mean": mean, "median": median, "range": rng,
"sd": sd, "iqr": iqr, "skewness": skew, "kurtosis": kurt
}
def summarize_df(df: pd.DataFrame):
return pd.DataFrame({col: describe_series(df[col]) for col in df.columns}).T
# Run and visualize
if __name__ == "__main__":
df = simulate(sims=10000, n=1000, lam=0.8, mu=1.0)
summary = summarize_df(df).round(4)
print("\nSummary Statistics (1000 runs, n=100)\n")
print(summary.to_string())
print("\nNote: kurtosis is excess kurtosis.\n")
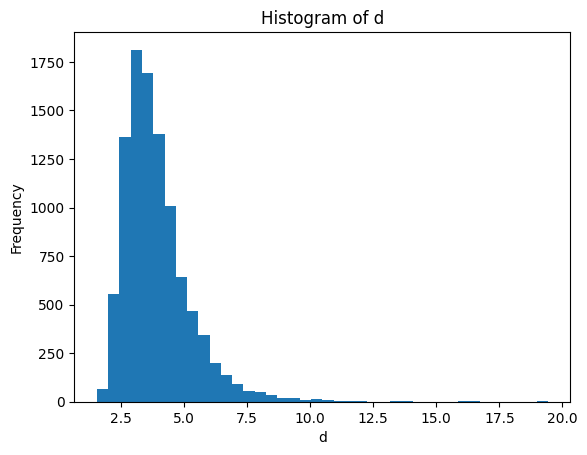
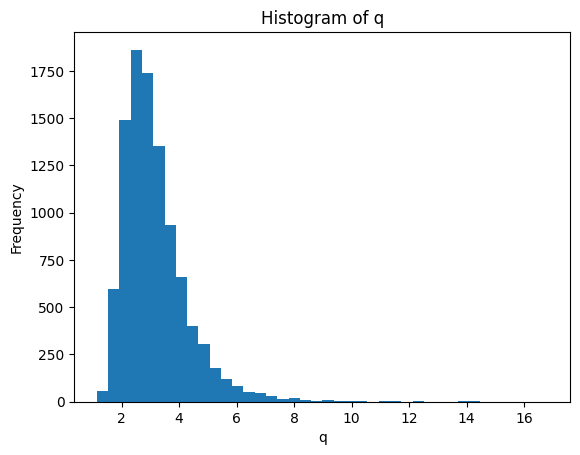
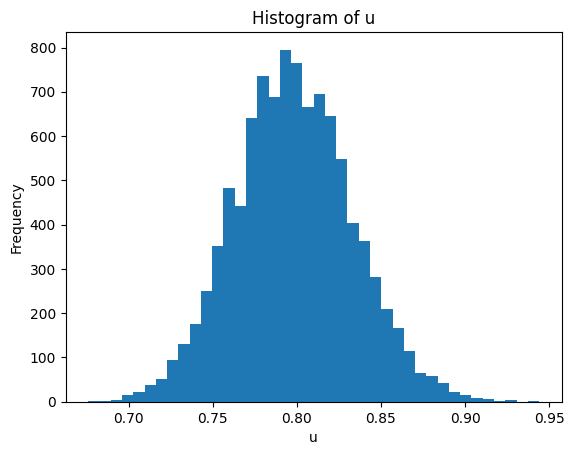
# Histograms
for metric in ["d","q","u"]:
plt.figure()
plt.hist(df[metric], bins=40)
plt.title(f"Histogram of {metric}")
plt.xlabel(metric)
plt.ylabel("Frequency")
plt.show()
Summary Statistics (1000 runs, n=100)

     mean  median   range      sd     iqr  skewness  kurtosis
d  3.9383   3.652  17.869  1.3823  1.4760    2.2989   11.5548
q  3.1686   2.922  15.685  1.1715  1.2452    2.3591   12.3087
u  0.7981   0.797   0.268  0.0351  0.0470    0.1216    0.0623

Note: kurtosis is excess kurtosis.